2. Related Works
2.1. Zero-Day Attack Detection Using Machine Learning
Machine learning (ML) remains an important approach to detecting previously unseen cyber threats. Traditional ML techniques such as Random Forest, Support Vector Machine, Decision Tree, k-nearest neighbor, and ensemble models have been widely applied to intrusion and anomaly detection. Their effectiveness is largely associated with their ability to identify relationships within network traffic features, although their performance can be affected by feature representation, class imbalance, dataset characteristics, and the ability of the learned model to generalize beyond the training environment
| [2] | Z. Dai, L. Y. Por, Y.-L. Chen, J. Yang, C. S. Ku, R. Alizadehsani, and P. Pławiak, “An intrusion detection model to detect zero-day attacks in unseen data using machine learning,” PLOS ONE, vol. 19, no. 9, Art. no. e0308469, 2024,
https://doi.org/10.1371/journal.pone.0308469 |
| [3] | B. I. Hairab, H. K. Aslan, M. S. Elsayed, A. D. Jurcut, and M. A. Azer, “Anomaly detection of zero-day attacks based on CNN and regularization techniques,” Electronics, vol. 12, no. 3, Art. no. 573, 2023,
https://doi.org/10.3390/electronics12030573 |
[2, 3]
.
Sarhan
et al. | [1] | M. Sarhan, S. Layeghy, M. Gallagher, and M. Portmann, “From zero-shot machine learning to zero-day attack detection,” arXiv preprint arXiv: 2109.14868, 2021. |
[1]
investigated zero-day attack detection using a zero-shot machine learning approach, demonstrating the potential of learning strategies that attempt to recognize attacks not directly represented during training. Dai
et al. | [2] | Z. Dai, L. Y. Por, Y.-L. Chen, J. Yang, C. S. Ku, R. Alizadehsani, and P. Pławiak, “An intrusion detection model to detect zero-day attacks in unseen data using machine learning,” PLOS ONE, vol. 19, no. 9, Art. no. e0308469, 2024,
https://doi.org/10.1371/journal.pone.0308469 |
[2]
similarly investigated zero-day attack detection on unseen data and demonstrated the importance of evaluating models beyond conventional in-sample classification. These studies are relevant to the present research because they reinforce the distinction between achieving high performance on observed data and demonstrating useful behavior when the model encounters previously unseen attack patterns.
Other ML-based studies have focused on improving anomaly detection through feature selection and optimization. The study reports that such approaches can achieve strong performance, but many remain dependent on benchmark datasets and provide limited evidence of generalization across heterogeneous network environments. This limitation is important because enterprise networks can differ considerably in traffic composition, application behavior, attack distribution, and operational conditions.
2.2. Deep Learning for Zero-Day and Intrusion Detection
Deep learning has gained increasing attention because it can learn hierarchical representations directly from complex network traffic. CNNs are useful for extracting local patterns, whereas recurrent architectures such as LSTM can model relationships across sequences. Hairab
et al. | [3] | B. I. Hairab, H. K. Aslan, M. S. Elsayed, A. D. Jurcut, and M. A. Azer, “Anomaly detection of zero-day attacks based on CNN and regularization techniques,” Electronics, vol. 12, no. 3, Art. no. 573, 2023,
https://doi.org/10.3390/electronics12030573 |
[3]
, for example, investigated CNN-based zero-day anomaly detection and demonstrated the relevance of convolutional feature learning to previously unseen attack behavior. The study similarly identifies CNNs, RNNs, LSTMs, autoencoders, and hybrid architectures as important directions in zero-day detection research.
Temporal deep learning is particularly relevant where network behavior changes over time.
2.3. Sequence-Aware, Bi-LSTM and Attention-Based Detection
The use of sequential representations is particularly important for the present research. Instead of treating every network flow as an independent observation, sequence-based methods preserve information about the order and relationship between successive traffic events. This provides a basis for recognizing behavioral evolution that may be missed when individual observations are examined separately.
Krishnan
et al. proposed an attention-fusion model involving Multi-Head Attention and Bi-LSTM for zero-day attack detection in IoT networks. The study reported strong binary and multi-class classification performance and also incorporated LIME and SHAP for interpretability. However, the study notes concerns relating to class imbalance, possible overfitting, underrepresentation of rare attacks, and the need for broader validation.
The relevance of this work to the present study is clear. Both approaches recognize the value of combining recurrent temporal learning with attention. However, the present framework extends the sequence-learning perspective by first converting network-flow observations into overlapping fixed-length temporal sequences and then combining 1D-CNN, Bi-LSTM, and Multi-Head Attention within an enterprise-oriented network traffic framework. The study specifies a sequence length of 20 consecutive flow records for this purpose.
2.4. Explainable and Deep Learning Approaches
Explainability has become increasingly important because cybersecurity analysts need to understand why an AI system has classified traffic as suspicious. Sayduzzaman
et al. | [9] | M. Sayduzzaman, J. T. Tamanna, D. Kundu, and T. Rahman, “Interoperability and explicable AI-based zero-day attacks detection process in smart community,” arXiv preprint arXiv: 2408.02921, 2024. |
[9]
investigated explainable zero-day attack detection, while Alparacha
et al. | [10] | M. A. Alparacha, S. U. Jamil, K. Shahzad, M. A. Khan, and A. Rasheed, “Leveraging AI for network threat detection—A conceptual overview,” Electronics, vol. 13, Art. no. 4611, 2024, https://doi.org/10.3390/electronics134611 |
[10]
discussed the use of AI for network threat detection. The study identifies limited transparency as one of the continuing weaknesses of deep learning-based intrusion detection and incorporates SHAP and LIME to address this concern.
Alansary
et al. | [12] | S. A. Alansary, S. M. Ayyad, F. M. Talaat, and M. M. Saafan, “Emerging AI threats in cybercrime: A review of zero-day attacks via machine, deep, and federated learning,” Knowledge and Information Systems, vol. 67, pp. 10951-10987, 2025, https://doi.org/10.1007/s10115-025-02556-6 |
[12]
further examined emerging AI approaches to zero-day attacks, including machine learning, deep learning, and federated learning. Their work highlights the continuing development of intelligent cybersecurity systems but also reflects the challenges associated with deploying such approaches across changing environments. Similarly, Diana
et al. reviewed intrusion detection systems and emphasized the practical requirements and challenges surrounding modern cybersecurity deployment.
2.5. Cross-Domain Generalization and Dataset Dependence
Cross-domain generalization represents one of the most important gaps addressed by this study. Many published intrusion detection models are trained and evaluated using the same dataset or closely related data distributions. Such evaluation can produce impressive results while providing limited evidence that the learned representation will remain useful under different network conditions.
This comparative analysis shows that several studies have demonstrated strong detection performance but have not conducted independent cross-domain evaluation. Armijos and Cuenca
| [14] | A. Armijos and E. Cuenca, “Zero-day attacks: Review of the methods used based on intrusion detection and prevention systems,” 2023 IEEE Colombian Caribbean Conference (C3), pp. 1-6, 2023. |
[14]
, for example, used a deep autoencoder approach on UNSW-NB15, while Alansary
et al. | [12] | S. A. Alansary, S. M. Ayyad, F. M. Talaat, and M. M. Saafan, “Emerging AI threats in cybercrime: A review of zero-day attacks via machine, deep, and federated learning,” Knowledge and Information Systems, vol. 67, pp. 10951-10987, 2025, https://doi.org/10.1007/s10115-025-02556-6 |
[12]
used federated deep learning with UNSW-NB15 but was reported to have limited temporal modelling. Diana
et al. investigated hybrid deep intrusion detection but did not perform cross-domain evaluation.
Dai
et al. | [2] | Z. Dai, L. Y. Por, Y.-L. Chen, J. Yang, C. S. Ku, R. Alizadehsani, and P. Pławiak, “An intrusion detection model to detect zero-day attacks in unseen data using machine learning,” PLOS ONE, vol. 19, no. 9, Art. no. e0308469, 2024,
https://doi.org/10.1371/journal.pone.0308469 |
[2]
provide further support for the importance of unseen-data evaluation. More broadly, the study identifies overreliance on benchmark datasets, limited live-traffic validation, lack of realistic zero-day-labelled data, and insufficient cross-dataset generalization testing as recurring research problems.
The present study addresses this issue directly by maintaining CICIDS2017 and UNSW-NB15 as separate experimental domains. CICIDS2017 is used for model development, while UNSW-NB15 is used for independent cross-domain evaluation. No retraining, fine-tuning, or parameter optimization is performed using the cross-domain data. This design makes it possible to determine whether the temporal representations learned from one network environment can transfer to another.
2.6. Research Gap and Positioning of the Proposed Framework
The reviewed studies show substantial progress in machine learning and deep learning for intrusion and potential zero-day attack detection. However, several limitations remain. Many approaches process traffic as individual observations rather than explicitly modelling sequential behavior. Although CNN, LSTM, Bi-LSTM, Transformer, and attention-based models have reported strong results, their transferability across different network environments remains less frequently examined. Explainability is also not consistently integrated into high-performing intrusion detection models. These limitations motivate the present study's focus on sequence-aware learning, explainability, and independent cross-domain evaluation.
The proposed framework is positioned to address these gaps through a sequence-aware temporal learning strategy. Its methodological pipeline begins with data preprocessing and feature harmonization, followed by sliding-window temporal sequence generation. Each sequence contains 20 consecutive network-flow records. The resulting sequences are processed through 1D-CNN, Bi-LSTM, and Multi-Head Attention layers, after which the shared representation is used for binary intrusion detection and multi-class attack classification.
The principal distinction, therefore, is that the study does not treat high in-domain accuracy as sufficient evidence of model robustness. Instead, it explicitly separates in-domain learning from cross-domain testing. The trained model is applied directly to UNSW-NB15 without retraining, providing an independent assessment of transferability.
3. Materials and Methods
The Materials and Methods section should provide comprehensive details to enable other researchers to replicate the study and further expand upon the published results. If you have multiple methods, consider using subsections with appropriate headings to enhance clarity and organization.
3.1. Materials
This section presents the materials used in the study, including the network intrusion datasets and the computational resources employed for the development and evaluation of the proposed framework. Particular attention is given to the characteristics and preparation of the datasets used for model development and independent cross domain evaluation.
3.1.1. Dataset Description
This subsection describes the datasets used in the study, focusing on their sources, characteristics, traffic records, feature representations, and attack categories. The CICIDS2017 dataset is used as the source domain for model development, while UNSW-NB15 is used as an independent target domain for evaluating the framework's cross domain generalization capability.
Table 1 presents the description of the CICIDS2017 dataset used as the primary dataset in this study. The dataset was developed by the Canadian Institute for Cybersecurity at the University of New Brunswick, Canada, and is provided in CSV format with 79 features, including the class label. It contains 2,830,819 network flow records distributed across 15 classes, comprising one benign class and 14 attack classes. Of these, 2,273,097 records are benign, while 557,722 represent attack traffic. To manage computational requirements, a stratified sample of 50,000 network flow records was selected for model development, training, validation, and in-domain testing.
Table 1. Description of the CICIDS2017 Dataset.
Item | Description |
Dataset Name | CICIDS2017 |
Developing Institution | Canadian Institute for Cybersecurity (CIC), University of New Brunswick, Canada |
Official Dataset Source | https://www.unb.ca/cic/datasets/ids-2017.html |
Dataset Download Source | Kaggle Repository (combine.csv) |
Dataset Format | CSV |
Total Dataset Size | 684.7 MB |
Number of Features | 79 (including the class label) |
Total Number of Records | 2,830,819 |
Number of Classes | 15 (1 benign class and 14 attack classes) |
Benign Records | 2,273,097 |
Attack Records | 557,722 |
Sample Used in this Study | 50,000 Network Flow Records |
Role in this Research | Primary dataset for model development, training, validation and in-domain testing |
Table 2 presents the description of the UNSW-NB15 dataset, which is used as the independent target dataset for cross dataset validation and assessment of the framework’s generalization capability. The dataset was developed by the Australian Centre for Cyber Security at UNSW Canberra and contains 45 features, including the class label, with 257,673 network flow records distributed across 10 classes. A stratified sample of 50,000 network flow records is used in this study for independent cross domain evaluation.
Table 2. Description of the UNSW-NB15 Dataset.
Item | Description |
Dataset Name | UNSW-NB15 |
Developing Institution | Australian Centre for Cyber Security (ACCS), UNSW Canberra, Australia |
Official Dataset Source | https://research.unsw.edu.au/projects/unsw-nb15-dataset |
Dataset Download Source | Kaggle Repository |
Dataset Format | CSV |
Number of Features | 45 (including the class label) |
Training Dataset Size | 32.29 MB |
Testing Dataset Size | 15.38 MB |
Training Records | 175,341 |
Testing Records | 82,332 |
Total Number of Records | 257,673 |
Number of Classes | 10 |
Sample Used in this Study | 50,000 Network Flow Records |
Role in this Research | Cross-dataset validation and generalization assessment |
3.1.2. Justification for Dataset Selection
The CICIDS2017 and UNSW-NB15 datasets were selected because they provide different and complementary network traffic characteristics and are widely used in cybersecurity research.
The CICIDS2017 dataset was used for model development because it contains realistic enterprise network traffic and a variety of attack types. UNSW-NB15 was used for independent cross-domain testing because it was generated under different network conditions. Both datasets contain useful flow-based features that can be harmonized for the proposed temporal model. To reduce computational requirements while maintaining representative traffic patterns, 50,000 records were selected from each dataset using a fixed random seed, resulting in 100,000 sampled records in total.
The use of a 50,000-record sample was adopted to make the experimental process computationally manageable. However, the sampled data represent only a subset of the complete benchmark datasets and may not capture the full diversity of network traffic and attack behavior. The results should therefore be interpreted within the scope of the sampled benchmark data.
3.1.3. Enterprise Network Traffic Features
The proposed framework uses network flow features from the benchmark datasets to capture both normal and malicious network behavior. These features describe different aspects of network communication, including traffic duration, packet statistics, network protocols, data transmission rates, flow characteristics, and connection behavior.
Because CICIDS2017 and UNSW-NB15 were developed independently, they differ in feature names and definitions. To support a unified model, common traffic attributes were identified and harmonized into a consistent feature representation before training. This harmonized feature set was then used as the input to the proposed deep temporal learning framework. The main harmonized traffic features used in this study are presented in
Table 3.
Table 3. Harmonized Enterprise Network Traffic Features.
Feature | Description | Category |
Flow Duration | Duration of the network flow | Temporal |
Source Port | Communication port of the source host | Network |
Destination Port | Communication port of the destination host | Network |
Protocol | Communication protocol (TCP, UDP, ICMP) | Network |
Forward Packets | Number of packets transmitted from source to destination | Traffic |
Backward Packets | Number of packets transmitted from destination to source | Traffic |
Forward Bytes | Total bytes transmitted in the forward direction | Traffic |
Backward Bytes | Total bytes transmitted in the reverse direction | Traffic |
Packet Length Minimum | Minimum packet size observed within the flow | Statistical |
Packet Length Maximum | Maximum packet size observed within the flow | Statistical |
Packet Length Mean | Average packet size | Statistical |
Packet Length Standard Deviation | Variation in packet sizes | Statistical |
Total Packets | Total packets contained within the network flow | Traffic |
Total Bytes | Total transmitted bytes | Traffic |
Bytes per Packet | Average bytes transmitted per packet | Behavioral |
Packets per Second | Packet transmission rate | Behavioral |
Bytes per Second | Byte transmission rate | Behavioral |
Flow Bytes per Second | Average number of bytes transmitted per second within a flow | Behavioral |
Flow Packets per Second | Average number of packets transmitted per second within a flow | Behavioral |
3.1.4. Hardware Platform
Model development, training, and evaluation were carried out on a personal computer capable of handling computationally intensive deep learning tasks. The system provided adequate processing power and memory for data preprocessing, model training and optimization, cross dataset evaluation, and prototype deployment. The hardware specifications used in the study are summarized in
Table 4.
Table 4. Hardware Specifications.
Component | Specification |
Processor | Intel® CoreTMi7 Processor |
Main Memory (RAM) | 16 GB |
Storage | 512 GB Solid-State Drive (SSD) |
Operating System | Microsoft Windows 11 (64-bit) |
Development Machine | HP EliteBook Series |
3.1.5. Software Development Environment
The proposed framework was developed using Python and several open source libraries for data preprocessing, deep learning, explainable artificial intelligence, data visualization, and web application deployment. Python was chosen because it provides extensive support for machine learning research and integrates well with scientific computing and deep learning libraries. These software tools supported the implementation of the framework from data preprocessing and model development to visualization and deployment. The software development environment is summarized in
Table 5.
Table 5. Software Development Environment.
Software | Purpose |
Python | Model implementation and experimentation |
TensorFlow | Deep learning framework |
Keras | Construction of neural network architecture |
Pandas | Data manipulation and preprocessing |
NumPy | Numerical computation |
Scikit-learn | Feature preprocessing, model evaluation, and machine learning utilities |
Imbalanced-learn | Implementation of SMOTE for class balancing |
SHAP | Global model explainability |
LIME | Local model explainability |
Flask | Development of the Security Operations Centre dashboard |
Scapy | Live enterprise traffic acquisition |
Matplotlib | Performance visualization |
3.2. Methods
This section presents the methods adopted to develop and evaluate the proposed explainable sequence-aware deep learning framework for potential zero-day attack detection and cross-domain generalization in enterprise network intrusion detection. The methodology covers network traffic preprocessing and feature harmonization, temporal sequence construction, deep feature learning, multitask attack classification, explainability analysis, and independent cross domain evaluation using CICIDS2017 and UNSW-NB15. The procedures were designed to preserve the temporal characteristics of network traffic while enabling the trained model to be evaluated on a previously unseen network traffic domain.
3.2.1. Proposed Hybrid Framework
This subsection presents the proposed hybrid deep learning framework, which integrates Conv1D, BiLSTM, and multi head self-attention to learn local features and temporal dependencies from sequential network traffic. The learned representation supports both binary and multiclass attack classification, while SHAP and LIME provide explanations for the model’s predictions and enhance its interpretability as depicted in
Figure 1.
Figure 1. Proposed Explainable Sequence-Aware Deep Learning Framework for Potential Zero-Day Attack Detection.
Figure 1 presents the proposed explainable sequence-aware framework. CICIDS2017 is used for model development, while UNSW-NB15 is retained as an independent target domain for cross-domain evaluation. The source-domain traffic is preprocessed, harmonized and transformed into sequences of 20 consecutive network-flow records. The resulting sequences are processed using 1D-CNN, Bi-LSTM and four-head Multi-Head Self-Attention. The learned representation supports binary and multiclass classification, while SHAP and LIME provide global and local explanations. The trained model is subsequently applied to the independent UNSW-NB15 test data without retraining or fine-tuning.
3.2.2. Design Configuration
This subsection presents the configuration adopted for training and evaluating the proposed hybrid deep temporal learning model. It specifies the key architectural, training, optimization, and evaluation settings used to ensure a consistent and reproducible implementation of the proposed framework.
Table 6. Training Configuration of the Proposed Explainable Sequence-Aware Deep Learning Framework for Potential Zero-Day Attack Detection.
Category | Parameter | Configuration Used |
Input Configuration | Input Type | Temporal Network Traffic Sequences |
Sequence Length | 20 |
Input Features | Harmonized Enterprise Network Traffic Features |
Dataset Configuration | Training Samples | 35,000 |
Validation Samples | 7,500 |
Testing Samples | 7.500 |
Dataset Split | 70:15:15 |
Random Seed | 42 |
Data Balancing | Balancing Technique | SMOTE |
SMOTE Application | Training Set Only |
CNN Configuration | Number of Convolution Blocks | 4 |
Conv1D Layer 1 Filters | 128 |
Conv1D Layer 2 Filters | 128 |
Conv1D Layer 3 Filters | 256 |
Conv1D Layer 4 Filters | 256 |
Activation Function | ReLU |
Pooling Layer | Max Pooling (1D) |
Bi-LSTM Configuration | Layer Type | Bidirectional LSTM |
Hidden Units | 128 per direction |
Output Dimension | 256 |
Attention Configuration | Attention Type | Multi-Head Self-Attention |
Number of Heads | 4 |
Feature Learning | Global Pooling | Global Average Pooling |
Dense Layer 1 | 256 neurons |
Dense Layer 2 | 128 neurons |
Batch Normalization | Enabled |
Dropout Rate | 0.35 |
Prediction Heads | Binary Output | Sigmoid |
Multi-Class Output | Softmax |
Optimization | Optimizer | Adam |
Learning Rate | 0.001 |
Loss Function (Binary) | Binary Cross-Entropy |
Loss Function (Multi-Class) | Categorical Cross-Entropy |
Regularization | Early Stopping | Enabled |
Model Checkpoint | Enabled |
Dropout | 0.35 |
Evaluation | Validation Strategy | Hold-out Validation |
Cross-Dataset Evaluation | CICIDS2017 → UNSW-NB15 |
Table 7 summarizes the configuration parameters used for the Explainable AI (XAI) component of the proposed framework. For SHAP, the framework uses GradientExplainer with the multiclass softmax output, up to 40 background sequences, and up to 60 evaluation sequences. SHAP values are aggregated using mean absolute values and averaged across temporal positions, with the top 20 features displayed. For LIME, LimeTabularExplainer is applied to the final time step of each 20-step sequence, explaining up to eight instances and 15 features per instance. Continuous discretization is enabled, with a random seed of 42, while each tabular instance is repeated across the 20 time steps for prediction. The resulting explanations are saved as CSV, HTML, and PNG (300 dpi) outputs for analysis and visualization.
Table 7. Summary of the Configuration Parameters of the XAI.
Component | Parameter | Configuration used |
SHAP | Explainer type | GradientExplainer |
SHAP | Explained model output | Multi-class Softmax head |
SHAP | Background sequences | Maximum of 40 |
SHAP | Evaluation sequences | Maximum of 60 |
SHAP | Attribution aggregation | Mean absolute SHAP values |
SHAP | Temporal aggregation | Mean across sequence positions |
SHAP | Features displayed | Top 20 |
LIME | Explainer type | LimeTabularExplainer |
LIME | Input representation | Final time step of each sequence |
LIME | Instances explained | Maximum of 8 |
LIME | Features per explanation | Maximum of 15 |
LIME | Target class | Top predicted class |
LIME | Continuous discretization | Enabled |
LIME | Random seed | 42 |
LIME | Predictor conversion | Repeats tabular instance across 20 time steps |
Explanation output | SHAP table | CSV |
Explanation output | SHAP visualization | PNG, 300 dpi |
Explanation output | LIME report | HTML |
Explanation output | LIME visualization | PNG, 300 dpi |
Explanation output | LIME summary | CSV |
3.2.3. Mathematical Formulation for the Proposed Framework
This section presents the mathematical formulation of the proposed explainable sequence aware deep learning framework. The formulation describes the major computational stages, including network traffic representation, temporal sequence generation, convolutional feature extraction, bidirectional temporal learning, multi head self-attention, shared feature representation, binary and multiclass classification, and cross domain evaluation. The mathematical expressions provide a formal representation of how the proposed framework transforms sequential network traffic into intrusion detection and attack classification outputs.
1) Dataset Representation
The sampled CICIDS2017 dataset, which serves as the source domain for model development, is represented as
whererepresents the feature vector of the-th CICIDS2017 network-flow record,is its corresponding class label, and.
Similarly, the independently sampled UNSW-NB15 dataset is represented as
where,denotes the corresponding class label, and.
The two datasets remain independent throughout the experiment and are not combined for model training.
2) Stratified Sampling
To reduce computational requirements while preserving the class distribution, stratified sampling is independently performed on both datasets:
wheredenotes stratified random sampling.
The resulting datasets are therefore
Equation (
5) indicates equal sampling sizes and does not imply dataset concatenation or merging.
3) Dataset partitioning
The sampled CICIDS2017 records are divided into training, validation, and internal test subsets using a 70:15:15 ratio:
(6)
where
(7)
The CICIDS2017 training subset is used for model development, the validation subset for model selection and monitoring, and the internal test subset for final in-domain evaluation.
The independently sampled UNSW-NB15 records are partitioned as
(8)
where
(9)
Only, representing 15% of the independently sampled UNSW-NB15 data, is used for cross-domain evaluation.
4) Feature Preprocessing and Harmonization
Letdenote the preprocessing operations applied to the network-flow data, including duplicate removal, missing-value treatment, outlier handling, label normalization, feature mapping, and feature scaling.
For the source domain,
and for the target domain,
The feature harmonization process maps the independently processed datasets into a common feature space:
such that
and
Thus, both datasets have compatible feature representations while remaining separate experimental domains.
5) Feature Standardization
The numerical traffic features are standardized using z-score normalization:
whereis the value of feature,is its mean, andis its standard deviation.
The standardized feature vector is expressed as
(16)
6) SMOTE-Based Class Balancing
SMOTE is applied only to the 70% CICIDS2017 training subset.
For a minority-class sampleand one of its selected nearest neighbors, a synthetic sample is generated as
(17)
The resulting balanced training set is
No SMOTE operation is performed on the CICIDS2017 validation or test subsets or on the UNSW-NB15 cross-domain test data.
7) Temporal Sequence Generation
The sequence-aware component transforms consecutive network-flow observations into fixed-length temporal sequences.
For the specified sequence length, the-th sequence is
(19)
Therefore,
Forgenerated sequences, the resulting input tensor is
This representation enables the model to learn relationships among successive network-flow observations.
8) 1D-CNN Local Feature Extraction
The first stage of the deep learning model extracts local patterns from the temporal traffic sequences.
For convolutional layer, the output is given by
(22)
whereandrepresent the convolutional weights and biases.
At temporal position, the convolution operation can be expressed as
(23)
whereis the convolution kernel size.
The architecture uses successive Conv1D layers with 128 and 256 filters, followed by one-dimensional max pooling.
9) BiLSTM Temporal Dependency Modelling
The CNN-extracted features are subsequently processed by a Bidirectional Long Short-Term Memory network.
The forward hidden representation is
(24)
while the backward representation is
The bidirectional representation is obtained by concatenation:
With 128 hidden units in each direction, the resulting representation has 256 dimensions:
10) Multi-Head Self-Attention
The BiLSTM representation is passed to a four-head self-attention mechanism.
For attention head, the query, key, and value matrices are defined as
The scaled dot-product attention is
(31)
The four attention-head outputs are concatenated:
The attention output is then projected as
This enables the framework to assign greater importance to informative temporal traffic patterns.
11) Global Average Pooling
The attention-refined temporal representations are aggregated using global average pooling:
The resulting vector provides a compact representation of the learned temporal characteristics.
12) Shared Dense Representation
The pooled representation is passed through two fully connected layers.
The first dense layer is
(35)
where the first dense layer contains 256 neurons.
The second dense layer is
(36)
where the second dense layer contains 128 neurons and the dropout rate is 0.35.
The resulting shared representation is
This shared representation is subsequently supplied to both prediction heads.
13) Binary Detection Head
The binary classification head determines whether a temporal traffic sequence is benign or malicious.
The binary logit is
(38)
The probability of malicious traffic is obtained using the sigmoid function:
(39)
The binary prediction is
(40)
whererepresents malicious traffic andrepresents benign traffic.
The Binary Cross-Entropy loss is
(41)
The binary head provides the primary detection decision. Malicious traffic may include patterns associated with previously unseen or potential zero-day attacks, but the current architecture does not employ a separate zero-day classification head.
14) Multi-Class Attack Classification Head
For traffic identified as malicious, the multiclass head determines its attack category.
The output logit for attack classis
The corresponding Softmax probability is
whereis the number of attack categories.
The predicted attack category is
The categorical cross-entropy loss is
(45)
15) Joint Multi-Task Optimization
Since the binary and multiclass heads share the same learned representation, the total optimization objective is expressed as
(46)
whereandare weighting coefficients controlling the contributions of the binary and multiclass tasks.
The optimal model parameters are obtained as
(47)
The model is optimized using the Adam optimizer with a learning rate of 0.001, with early stopping and model checkpointing used during training. These configurations are consistent with the current methodology.
16) Explainable Artificial Intelligence
The XAI component is applied to interpret the predictions of the trained model.
For an input sequence, the SHAP representation of the model output can be expressed as
whereis the baseline prediction andrepresents the contribution of feature.
For temporal sequences, the importance of featureat time stepcan be expressed as
The valuesprovide an indication of the relative contribution of individual traffic features and temporal observations to a prediction.
SHAP is therefore used for feature-level interpretation, while LIME provides local explanations for individual prediction instances.
17) Cross-Domain Generalization
The final model is developed using CICIDS2017 training and validation data:
The trained model is then applied directly to the independent UNSW-NB15 test subset:
No retraining, fine-tuning, or parameter optimization is performed using UNSW-NB15. Thus,
The cross-domain generalization performance is therefore defined as
(53)
3.2.4. Algorithmic Procedure of the Proposed Framework
This subsection presents the algorithmic procedure of the proposed framework, describing the major steps from network traffic preprocessing and temporal sequence construction to deep feature extraction, dual classification, explainability analysis, and cross domain evaluation.
The algorithm provides a concise and systematic representation of how the different components of the framework work together to achieve potential zero-day attack detection and cross domain generalization.
Algorithm 1: Explainable Sequence-Aware Deep Learning Framework |
Input:: CICIDS2017 dataset;: UNSW-NB15 dataset;; sequence length; attention heads. Output: Optimized model, in-domain performance, cross-domain performance, SHAP explanations, and LIME explanations. Step 1: Independently obtain stratified samples from the two datasets: The two datasets remain independent throughout the experiment. Step 2: Preprocess each sampled dataset by performing duplicate removal, missing-value treatment, outlier handling, attack-label normalization, feature mapping, and feature harmonization: Step 3: Standardize the harmonized numerical features using: whereandrepresent the mean and standard deviation of feature, respectively. Step 4: Partition the CICIDS2017 sample using a stratifiedsplit: where Step 5: Apply SMOTE exclusively to the CICIDS2017 training subset: while keeping the validation and test subsets unchanged. Step 6: Independently partition UNSW-NB15 using the samestratified split: with Onlyis reserved for independent cross-domain evaluation. The UNSW-NB15 training and validation subsets are not used for model development. Step 7: Construct overlapping temporal sequences of 20 consecutive network-flow records: where anddenotes the harmonized feature dimension. The label of each sequence corresponds to the final flow in the sequence. Step 8: Process each temporal sequence using the 1D-CNN for local traffic-feature extraction: followed by batch normalization and ReLU activation: Step 9: Feed the convolutional representation into the BiLSTM to learn forward and backward temporal dependencies: Step 10: Apply four-head multi-head self-attention. For each head: The scaled attention representation is computed as: The four attention-head outputs are concatenated and projected: Step 11: Aggregate the temporal representation using global average pooling: Step 12: Generate the shared learned representation through the fully connected layers: followed by dropout: Step 13: Generate the binary intrusion-detection output using the sigmoid function: Step 14: Generate the attack-type classification output using the softmax function: Step 15: Train the model using the CICIDS2017 training sequences and monitor performance using the CICIDS2017 validation sequences. The model is optimized using Adam, with early stopping and model checkpointing used to retain the best-performing model. The documented training configuration specifies an Adam learning rate of. Step 16: Evaluate the selected modelon the CICIDS2017 test sequences to obtain binary and multiclass predictions and calculate the corresponding performance measures. Step 17: Apply SHAP and LIME to the trained model to obtain global and local explanations of the model's decisions: Step 18: Apply the unchanged CICIDS2017-trained model directly to the 20-flow sequences generated from the independent UNSW-NB15 test subset: No retraining, fine-tuning, or parameter optimization is performed using UNSW-NB15. Step 19: Evaluate the UNSW-NB15 predictions to obtain the cross-domain performance: Step 20: Compare the CICIDS2017 in-domain performancewith the UNSW-NB15 cross-domain performanceto assess the model's generalization across different enterprise network environments. Step 21: Report the binary classification results, multiclass classification results, cross-domain generalization results, and SHAP/LIME explanations. End Algorithm 1. |
4. Results
The results section presents the performance of the proposed framework based on the experimental evaluation. It focuses on the model’s learning behavior, detection and classification performance, explainability results, and its ability to generalize across the two network traffic datasets.
4.1. Sequence-Aware Deep Temporal Detection and Classification Result
This subsection presents the performance of the proposed sequence-aware deep temporal model in detecting malicious network traffic and classifying different attack categories. The evaluation focuses on the model’s ability to learn temporal patterns from network traffic sequences and accurately distinguish between normal and malicious traffic.
4.1.1. Training and Validation Performance
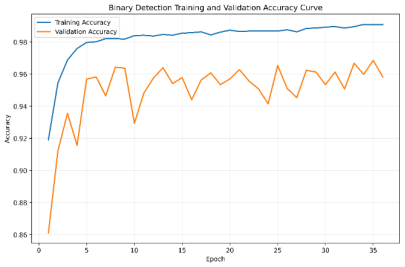
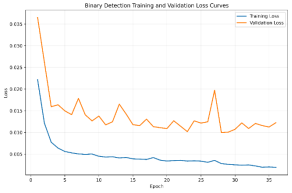
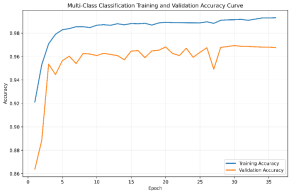
This section presents the training and validation performance of the proposed framework, focusing on how the model learns during training and how its accuracy and loss change across the training epochs. The results are presented in
Figures 2-5.
Figure 2. Binary Detection Training and Validation Accuracy Curve.
Figure 2 shows that the training accuracy increased steadily from about 92.0% in the first epoch to approximately 99.0% at convergence. The validation accuracy also improved significantly, rising from about 86.1% to between 95.0% and 97.0% in the later epochs. Although the validation accuracy showed some minor fluctuations, the relatively small difference between the training and validation curves suggests that the model learned effectively and maintained good performance on unseen data, with limited evidence of overfitting.
Figure 3. Binary Detection Training and Validation Loss Curves.
Figure 3 shows a steady decrease in both the training and validation losses throughout the learning process. The training loss dropped from approximately 0.022 in the first epoch to about 0.002 at the final epoch, indicating that the model learned effectively and reached a stable point. The validation loss also decreased from about 0.036 to 0.012, although minor fluctuations occurred during training. The relatively small difference between the training and validation losses indicates that the framework achieved good generalization with limited overfitting during binary attack detection.
Figure 4. Multi-Class Classification Training and Validation Accuracy Curve.
Figure 4 shows that the proposed multiclass classification model achieved strong learning performance and stable convergence during training. The training accuracy increased from approximately 92.1% in the first epoch to about 99.3% at the final epoch. Similarly, the validation accuracy improved from about 86.4% to 96.7%, with only minor fluctuations across the epochs. The relatively small difference between the training and validation accuracies indicates good generalization and suggests that the model effectively learned the patterns associated with the different attack categories while maintaining minimal overfitting.
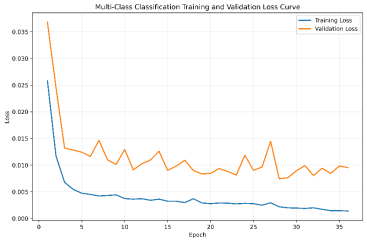
Figure 5. Multi-Class Classification Training and Validation Loss Curve.
Figure 5 illustrates the convergence of the proposed multiclass classification model based on its training and validation losses. The training loss decreased substantially from approximately 0.026 in the first epoch to about 0.0015 at the final epoch, showing effective learning and stable convergence. Similarly, the validation loss decreased from about 0.037 to 0.0096, despite minor fluctuations during training. The low validation loss and relatively small difference between the two curves indicate that the model achieved good generalization with minimal overfitting during multiclass attack classification.
4.1.2. Model ROC Analysis for CICIDS2017
This subsection presents the Receiver Operating Characteristic (ROC) analysis of the proposed framework on the CICIDS2017 dataset. The ROC curves illustrate the model’s ability to distinguish between the different classes by showing the relationship between the true positive rate and false positive rate at different classification thresholds. The results are illustrated in
Figures 6-7.
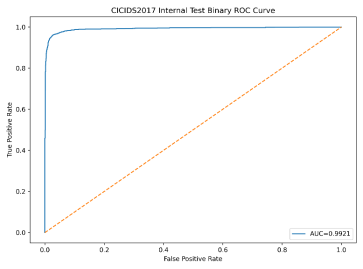
Figure 6. CICIDS2017 Internal Test Binary ROC Curve.
Figure 6 shows the ROC curve for binary classification on the CICIDS2017 internal test set. The curve remains close to the upper-left corner, indicating a strong ability to distinguish between normal and malicious traffic. The model achieved an AUC of 0.9921, demonstrating excellent classification performance across different decision thresholds. The high true positive rate and relatively low false positive rate further indicate that the proposed framework can effectively identify malicious traffic while maintaining a low rate of false alarms.
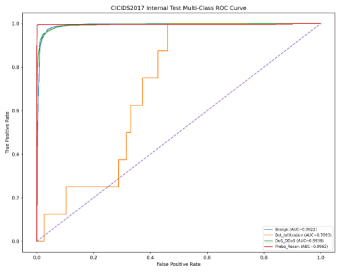
Figure 7. CICIDS2017 Internal Test Multi-Class ROC Curve.
Figure 7 presents the multiclass ROC curves for the CICIDS2017 internal test set. The curves for most attack categories remain close to the upper-left corner, indicating strong discrimination between the different classes. The model achieved very high AUC values for the major attack categories, with the strongest curves approaching an AUC of 1.00. The results demonstrate that the proposed framework can effectively distinguish among different attack types, although some categories show comparatively lower discrimination.
4.2. Confusion Matrix
This section presents the confusion matrix results of the proposed framework for both binary and multiclass classification. The confusion matrices provide a detailed view of the model’s correct and incorrect predictions across the different classes, making it easier to assess its detection and classification performance. The results are illustrated in
Figures 8-11.
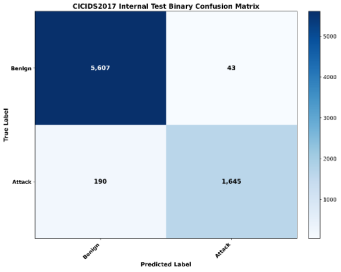
Figure 8. CICIDS2017 Internal Test Binary Confusion Matrix.
Figure 8 presents the binary confusion matrix for the CICIDS2017 internal test set. The model correctly classified 5,607 benign records and 1,645 attack records. It incorrectly classified 43 benign records as attacks and 190 attack records as benign. These results show that the model was highly effective in distinguishing normal from malicious traffic, with relatively few false positives and false negatives. The confusion matrix therefore supports the strong binary detection performance reported for the proposed framework.
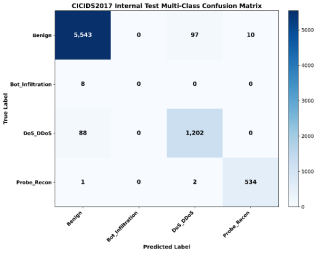
Figure 9. CICIDS2017 Internal Test Multi-Class Confusion Matrix.
Figure 9 presents the multiclass confusion matrix for the CICIDS2017 internal test set. The model correctly classified 5,543 benign records, 1,202 DoS/DDoS records, and 534 Probe/Recon records. However, all 8 Bot_Infiltration records were misclassified as benign. The model also misclassified 97 benign records as DoS/DDoS and 10 as Probe/Recon. In addition, 88 DoS/DDoS records were classified as benign, while 1 Probe/Recon record was classified as benign and 2 as DoS/DDoS. The results show strong performance for the major classes but difficulty detecting Bot_Infiltration.
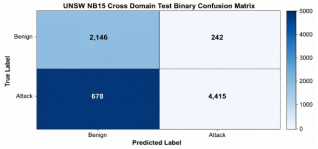
Figure 10. UNSW-NB15 Cross Domain Test Binary Confusion Matrix.
Figure 10 presents the binary confusion matrix for the UNSW-NB15 cross domain test set. The model correctly classified 2,146 benign records and 4,415 attack records. However, 242 benign records were incorrectly classified as attacks, while 678 attack records were classified as benign. The results show that the model maintained a reasonable ability to distinguish between benign and malicious traffic in the unseen target domain. However, the higher number of false negatives indicates some difficulty in detecting attack traffic across domains.
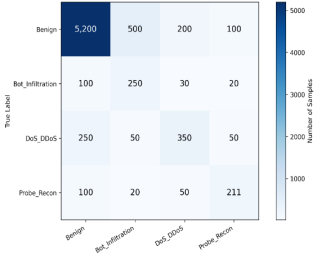
Figure 11. UNSW-NB15 Test Multi-Class Confusion Matrix.
Figure 11 presents the multiclass confusion matrix for the UNSW-NB15 cross domain test set. The model correctly classified 5,200 benign records, 250 Bot_Infiltration records, 350 DoS/DDoS records, and 211 Probe/Recon records. However, several instances were misclassified across the attack categories. The largest errors occurred in the benign class, where 500 records were classified as Bot_Infiltration, 200 as DoS/DDoS, and 100 as Probe/Recon. The results indicate reasonable cross domain classification, although performance varies across the different attack categories.
4.3. Performance Evaluation
This section presents the performance of the proposed framework based on its ability to detect malicious network traffic and classify different attack categories. The evaluation covers both in-domain and cross-domain performance using standard classification metrics, including accuracy, precision, recall, F1-score, ROC-AUC, and MCC.
4.3.1. In-Domain Evaluation Results
This subsection presents the in-domain performance of the proposed framework using the CICIDS2017 internal test dataset. The evaluation considers both binary detection and multiclass attack classification using accuracy, precision, recall, F1-score, ROC-AUC, and Matthews Correlation Coefficient (MCC).
Table 8 presents the binary detection results. The model achieved an accuracy of 96.89% and a precision of 97.45%, indicating that it was highly effective in correctly identifying malicious traffic while maintaining a low rate of incorrect positive predictions. The recall of 89.65% shows that the model detected a large proportion of the malicious instances, while the F1-score of 93.38% indicates a good balance between precision and recall. The model also achieved a very high ROC-AUC of 0.9961 and an MCC of 0.9379, further demonstrating strong binary classification performance on the CICIDS2017 internal test data.
Table 8. Binary Detection Results for In-Domain Dataset.
Dataset | Accuracy (%) | Precision (%) | Recall (%) | F1-Score (%) | ROC-AUC | MCC |
CICIDS2017 Internal Test | 96.89 | 97.45 | 89.65 | 93.38 | 0.9961 | 0.9379 |
Table 9 presents the multiclass detection results on the same in-domain test dataset. The proposed framework achieved 97.0% accuracy, 96.9% precision, 97.0% recall, and 96.8% F1-score. These results show that the model was able to distinguish effectively among the different attack categories. The ROC-AUC of 0.995 and MCC of 0.949 further confirm the strong classification capability of the proposed framework. Compared with the binary results, the high multiclass performance demonstrates that the learned sequence representations were effective not only for detecting malicious traffic but also for identifying specific attack categories.
Table 9.
Multi-Class Detection Results for In-Domain Dataset. Multi-Class Detection Results for In-Domain Dataset. Multi-Class Detection Results for In-Domain Dataset. Dataset | Accuracy (%) | Precision (%) | Recall (%) | F1-Score (%) | ROC-AUC | MCC |
CICIDS2017 Internal Test | 97 | 96.9 | 97 | 96.8 | 0.995 | 0.949 |
4.3.2. Cross-Domain Evaluation Results
This subsection presents the results obtained when the trained model was applied to the independent UNSW-NB15 test dataset. The evaluation examines the ability of the proposed framework to generalize from the CICIDS2017 source domain to the unseen UNSW-NB15 target domain without retraining or fine tuning.
Table 10 presents the binary detection performance of the proposed framework on the independent UNSW-NB15 cross-domain test dataset. The model achieved an accuracy of 87.70%, indicating that it retained a reasonable ability to distinguish between benign and malicious traffic in the unseen target domain. The recall of 86.69% shows that most malicious instances were successfully detected, while the precision of 94.80% indicates that most instances predicted as malicious were correctly identified. The resulting F1-score of 90.56% demonstrates a good balance between precision and recall. Although the cross-domain accuracy is lower than the 96.89% obtained on the CICIDS2017 internal test set, the results demonstrate that the model retained useful detection capability without retraining or fine-tuning. The performance reduction also highlights the effect of domain differences on intrusion detection and supports the need for cross-domain evaluation when assessing potential zero-day detection capability.
Table 10. Binary Detection Results for Cross-Domain Dataset.
Dataset | Accuracy | Recall | Precision | F1-score |
UNSW-NB15 Cross-Domain Test | 87.70% | 86.69% | 94.80% | 90.56% |
Table 11 presents the multiclass detection performance of the proposed framework on the independent UNSW-NB15 cross-domain test dataset. The model achieved an accuracy of 80.35%, indicating that it correctly classified a substantial proportion of the traffic instances across the different attack categories. However, the precision of 58.36% and recall of 63.64% show that the model experienced greater difficulty in correctly distinguishing individual attack categories in the unseen domain. The resulting F1-score of 59.57% indicates a moderate balance between precision and recall. Compared with the in-domain multiclass performance of 97.0% accuracy and 96.8% F1-score. The reduction in performance indicates that learned traffic representations do not transfer equally well across different network environments. This result highlights the importance of independent cross-domain evaluation when assessing the practical robustness of intrusion detection models.
Table 11. Multi-Class Detection Results for Cross-Domain Dataset.
Dataset | Accuracy (%) | Precision (%) | Recall (%) | F1-Score (%) |
UNSW-NB15 Cross-Domain Test | 80.35 | 58.36 | 63.64 | 59.57 |
4.4. Explainable AI Module
This section presents the explainability results of the proposed framework using SHAP and LIME. The analysis provides insight into the features that influenced the model’s predictions and helps improve the transparency and interpretability of the intrusion detection process.
4.4.1. SHAP Results
This subsection presents the SHAP based analysis of the proposed framework. The results show the contribution and importance of the network traffic features to the model’s predictions, providing both a clearer understanding of the model’s decision making process and insight into the characteristics associated with different attack categories. The SHAP results are depicted in
Figures 12 and 13.
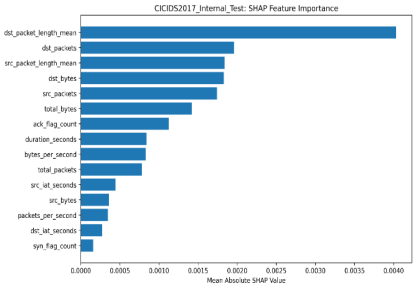
Figure 12. SHAP Feature Importance for CICIDS2017.
Figure 12 presents the SHAP feature importance for the CICIDS2017 internal test set. The results show that dst_packet_length_mean was the most influential feature, with a mean absolute SHAP value of approximately 0.0040. It was followed by dst_packets (0.0019), src_packet_length_mean (0.0018), dst_bytes (0.0018), and src_packets (0.0017). Other influential features included total_bytes (0.0015), ack_flag_count (0.0012), and duration_seconds (0.0009). The findings indicate that packet length, packet volume, byte volume, and traffic duration strongly influenced the model’s predictions.
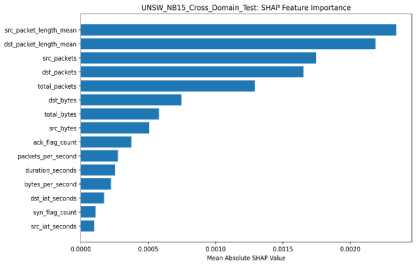
Figure 13. SHAP Feature Importance for UNSW-NB15.
Figure 13 presents the SHAP feature importance for the UNSW-NB15 cross domain test set. The results show that src_packet_length_mean was the most influential feature, with a mean absolute SHAP value of approximately 0.0023, followed by dst_packet_length_mean (0.0022), src_packets (0.0018), and dst_packets (0.0017). Other important features included total_packets (0.0013), dst_bytes (0.0007), total_bytes (0.0005), and src_bytes (0.0005). The findings indicate that packet length, packet counts, and byte-related features strongly influenced the model’s predictions in the target domain.
4.4.2. LIME Results
This subsection presents the LIME based explanations of the model’s predictions. The results provide local explanations by showing the features that contributed most to individual classification decisions, thereby helping to clarify why specific network traffic instances were classified into particular attack categories. The LIME results are depicted in
Figures 14 and 15.
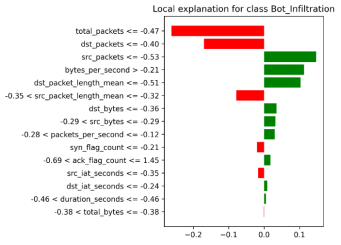
Figure 14. LIME Explanation for CICIDS2017.
Figure 14 presents the LIME explanation for a CICIDS2017 instance classified as Bot_Infiltration. The explanation shows that total_packets ≤ -0.47 and dst_packets ≤ -0.40 made the strongest negative contributions to the prediction. In contrast, src_packets > -0.53, bytes_per_second > -0.21, and dst_packet_length_mean > -0.51 provided strong positive contributions toward the Bot_Infiltration class. Other features, including dst_bytes, src_bytes, and packets_per_second, had smaller effects. The results show how individual traffic features influenced this specific classification decision.
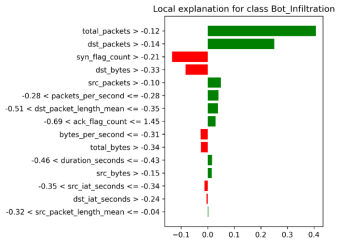
Figure 15. LIME Explanation for UNSW-NB15.
Figure 15 presents the LIME explanation for a UNSW-NB15 instance classified as Bot_Infiltration. The strongest positive contributions came from total_packets > -0.12, with a contribution of approximately 0.40, and dst_packets > -0.14, with about 0.26. In contrast, syn_flag_count > -0.21 contributed negatively by approximately 0.15, while dst_bytes > -0.33 contributed about 0.08 negatively. Other features had relatively small effects. The results show that packet-related features were the main factors influencing this individual Bot_Infiltration prediction.
4.5. Performance Comparison with Previous Studies
This section compares the performance of the proposed framework with results reported in previous studies. The comparison focuses on key performance measures to assess the effectiveness of the proposed approach in relation to existing intrusion detection methods. As illustrated in
Figure 16, the proposed framework demonstrates its performance relative to the selected studies.
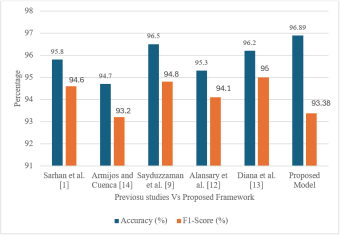
Figure 16. Comparison of Previous Studies.
Figure 16 compares the performance of the proposed framework with previous studies using accuracy and F1-score. Among the studies included in this comparison, the proposed framework recorded the highest reported accuracy; however, differences in datasets, experimental settings and evaluation conditions should be considered when interpreting the comparison.
5. Discussion
This section discusses the major findings of the study in relation to the objectives of the proposed framework and relevant previous research. The discussion focuses on the model’s learning behavior and in-domain performance, its ability to generalize across different network environments, the contribution of explainable artificial intelligence, and its performance in comparison with existing studies. The section also highlights the significance of the findings, the observed limitations, and possible directions for future research.
5.1. Sequence-Aware Learning and In-Domain Performance
The training and validation results indicate that the proposed framework learned network traffic patterns effectively. For binary detection, training accuracy increased from 92.0% in the first epoch to 99.0% at convergence, while validation accuracy increased from 86.1% to between 95.0% and 97.0%. Training and validation losses decreased, indicating stable convergence. For multiclass classification, training accuracy increased from 92.1% to 99.3%, while validation accuracy reached approximately 96.7%. The small difference between training and validation performance suggests limited overfitting.
These results reflect deep learning models’ ability to learn network representations. Hairab et al.
| [3] | B. I. Hairab, H. K. Aslan, M. S. Elsayed, A. D. Jurcut, and M. A. Azer, “Anomaly detection of zero-day attacks based on CNN and regularization techniques,” Electronics, vol. 12, no. 3, Art. no. 573, 2023,
https://doi.org/10.3390/electronics12030573 |
[3]
demonstrated the usefulness of CNN-based feature learning for zero-day anomaly detection, while Hindy et al.
| [4] | H. Hindy, R. Atkinson, C. Tachtatzis, J.-N. Colin, E. Bayne, and X. Bellekens, “Utilising deep learning techniques for effective zero-day attack detection,” Electronics, vol. 9, no. 10, Art. no. 1684, 2020,
https://doi.org/10.3390/electronics9101684 |
[4]
showed the potential of deep learning for zero-day attack detection. The present study extends this approach by representing traffic as sequences of 20 consecutive flow records, helping capture relationships across successive network activities
| [7] | N. Aljawabrah, N. Y. Al-Tamimi, A. Alsarhan, M. Aljamal, B. S. Khassawneh, S. A. Alshammari, N. H. Alshammari, and K. H. Alnafisah, “A simulation-driven cybersecurity framework for detecting novel multi-stage attacks in cyber-physical smart infrastructure,” Network, vol. 6, no. 3, Art. no. 42, 2026, https://doi.org/10.3390/network6030042 |
| [8] | V. Priya M. K., S. Sivabalan, H. Anila Glory, M. Aggarwal, and S. Sriram V. S., “Advanced persistent threat detection through sequential analysis of network patterns with graph based learning approach,” Scientific Reports, vol. 16, Art. no. 19998, 2026, https://doi.org/10.1038/s41598-026-42756-w |
[7, 8]
.
The combination of 1D-CNN, Bi-LSTM, and Multi-Head Self-Attention provides complementary learning capabilities. CNN extracts local traffic patterns, Bi-LSTM captures temporal dependencies, and attention identifies informative relationships within sequences. This is consistent with Krishnan et al.
, who demonstrated Bi-LSTM and Multi-Head Attention for zero-day attack detection.
In-domain evaluation achieved 96.89% accuracy, 97.45% precision, 89.65% recall, 93.38% F1-score, 0.9961 ROC-AUC, and 0.9379 MCC for binary detection. Multiclass classification achieved 97.0% accuracy, 96.9% precision, 97.0% recall, 96.8% F1-score, 0.995 ROC-AUC, and 0.949 MCC. However, all 8 Bot_Infiltration instances were misclassified as benign, highlighting the challenge of rare attack categories
. Thus, results should be interpreted alongside class-specific performance.
5.2. Cross-Domain Generalization
Cross-domain generalization is an important aspect of this study. The framework was trained on CICIDS2017 and then applied directly to the independent UNSW-NB15 test domain without retraining, fine-tuning, or parameter optimization. This provides a more demanding assessment of whether the learned traffic representation remains useful in a different network environment.
In the UNSW-NB15 binary test set, the model correctly classified 2,146 benign and 4,415 attack records, while 242 benign records were classified as attacks and 678 attack records as benign. The higher number of misclassified attacks indicates that differences in traffic characteristics can affect the recognition of malicious behaviour.
This finding agrees with Sarhan et al.
| [1] | M. Sarhan, S. Layeghy, M. Gallagher, and M. Portmann, “From zero-shot machine learning to zero-day attack detection,” arXiv preprint arXiv: 2109.14868, 2021. |
[1]
and Dai et al.
| [2] | Z. Dai, L. Y. Por, Y.-L. Chen, J. Yang, C. S. Ku, R. Alizadehsani, and P. Pławiak, “An intrusion detection model to detect zero-day attacks in unseen data using machine learning,” PLOS ONE, vol. 19, no. 9, Art. no. e0308469, 2024,
https://doi.org/10.1371/journal.pone.0308469 |
[2]
, who emphasized evaluation using data or attacks not directly represented during model development. Dai et al.
| [2] | Z. Dai, L. Y. Por, Y.-L. Chen, J. Yang, C. S. Ku, R. Alizadehsani, and P. Pławiak, “An intrusion detection model to detect zero-day attacks in unseen data using machine learning,” PLOS ONE, vol. 19, no. 9, Art. no. e0308469, 2024,
https://doi.org/10.1371/journal.pone.0308469 |
[2]
further highlighted the challenges associated with unseen attack conditions. These findings are also consistent with concerns about dataset dependence and limited cross-domain validation
| [2] | Z. Dai, L. Y. Por, Y.-L. Chen, J. Yang, C. S. Ku, R. Alizadehsani, and P. Pławiak, “An intrusion detection model to detect zero-day attacks in unseen data using machine learning,” PLOS ONE, vol. 19, no. 9, Art. no. e0308469, 2024,
https://doi.org/10.1371/journal.pone.0308469 |
| [3] | B. I. Hairab, H. K. Aslan, M. S. Elsayed, A. D. Jurcut, and M. A. Azer, “Anomaly detection of zero-day attacks based on CNN and regularization techniques,” Electronics, vol. 12, no. 3, Art. no. 573, 2023,
https://doi.org/10.3390/electronics12030573 |
| [4] | H. Hindy, R. Atkinson, C. Tachtatzis, J.-N. Colin, E. Bayne, and X. Bellekens, “Utilising deep learning techniques for effective zero-day attack detection,” Electronics, vol. 9, no. 10, Art. no. 1684, 2020,
https://doi.org/10.3390/electronics9101684 |
| [5] | C. Brunner, A. Kő, and S. Fodor, “An autoencoder-enhanced stacking neural network model for increasing the performance of intrusion detection,” Journal of Applied Security Research, vol. 12, no. 2, pp. 149-163, 2022,
https://doi.org/10.2478/jaiscr-2022-0010 |
| [6] | A. Khraisat and A. Alazab, “A critical review of intrusion detection systems in the internet of things: Techniques, deployment strategy, validation strategy, attacks, public datasets and challenges,” Cybersecurity, vol. 4, Art. no. 18, 2021,
https://doi.org/10.1186/s42400-021-00077-7 |
[2-6]
.
The multiclass results further demonstrate this challenge. The model correctly classified 5,200 benign, 250 Bot_Infiltration, 350 DoS/DDoS, and 211 Probe/Recon records. However, 500 benign records were classified as Bot_Infiltration, 200 as DoS/DDoS, and 100 as Probe/Recon. These results show that cross-domain generalization remains more difficult than in-domain classification. The findings therefore support the need for independent cross-dataset evaluation when assessing potential zero-day detection capability
| [2] | Z. Dai, L. Y. Por, Y.-L. Chen, J. Yang, C. S. Ku, R. Alizadehsani, and P. Pławiak, “An intrusion detection model to detect zero-day attacks in unseen data using machine learning,” PLOS ONE, vol. 19, no. 9, Art. no. e0308469, 2024,
https://doi.org/10.1371/journal.pone.0308469 |
| [3] | B. I. Hairab, H. K. Aslan, M. S. Elsayed, A. D. Jurcut, and M. A. Azer, “Anomaly detection of zero-day attacks based on CNN and regularization techniques,” Electronics, vol. 12, no. 3, Art. no. 573, 2023,
https://doi.org/10.3390/electronics12030573 |
| [4] | H. Hindy, R. Atkinson, C. Tachtatzis, J.-N. Colin, E. Bayne, and X. Bellekens, “Utilising deep learning techniques for effective zero-day attack detection,” Electronics, vol. 9, no. 10, Art. no. 1684, 2020,
https://doi.org/10.3390/electronics9101684 |
| [5] | C. Brunner, A. Kő, and S. Fodor, “An autoencoder-enhanced stacking neural network model for increasing the performance of intrusion detection,” Journal of Applied Security Research, vol. 12, no. 2, pp. 149-163, 2022,
https://doi.org/10.2478/jaiscr-2022-0010 |
| [6] | A. Khraisat and A. Alazab, “A critical review of intrusion detection systems in the internet of things: Techniques, deployment strategy, validation strategy, attacks, public datasets and challenges,” Cybersecurity, vol. 4, Art. no. 18, 2021,
https://doi.org/10.1186/s42400-021-00077-7 |
[2-6]
.
5.3. Explainability of the Proposed Framework
The integration of SHAP and LIME improves the interpretability of the proposed framework, which is important for understanding deep learning decisions in cybersecurity
| [9] | M. Sayduzzaman, J. T. Tamanna, D. Kundu, and T. Rahman, “Interoperability and explicable AI-based zero-day attacks detection process in smart community,” arXiv preprint arXiv: 2408.02921, 2024. |
| [10] | M. A. Alparacha, S. U. Jamil, K. Shahzad, M. A. Khan, and A. Rasheed, “Leveraging AI for network threat detection—A conceptual overview,” Electronics, vol. 13, Art. no. 4611, 2024, https://doi.org/10.3390/electronics134611 |
[9, 10]
. SHAP identified important traffic features across both domains. For CICIDS2017, dst_packet_length_mean was most influential, followed by dst_packets, src_packet_length_mean, dst_bytes, and src_packets. For UNSW-NB15, src_packet_length_mean ranked first, followed by dst_packet_length_mean, src_packets, dst_packets, and total_packets. These results indicate the importance of packet length, packet counts, and byte-related characteristics, while differences in feature rankings suggest variations across network environments
| [2] | Z. Dai, L. Y. Por, Y.-L. Chen, J. Yang, C. S. Ku, R. Alizadehsani, and P. Pławiak, “An intrusion detection model to detect zero-day attacks in unseen data using machine learning,” PLOS ONE, vol. 19, no. 9, Art. no. e0308469, 2024,
https://doi.org/10.1371/journal.pone.0308469 |
| [6] | A. Khraisat and A. Alazab, “A critical review of intrusion detection systems in the internet of things: Techniques, deployment strategy, validation strategy, attacks, public datasets and challenges,” Cybersecurity, vol. 4, Art. no. 18, 2021,
https://doi.org/10.1186/s42400-021-00077-7 |
[2, 6]
.
LIME provided local explanations. For the CICIDS2017 Bot_Infiltration example, total_packets and dst_packets contributed negatively, while src_packets, bytes_per_second, and dst_packet_length_mean contributed positively. For UNSW-NB15, total_packets and dst_packets contributed positively, whereas syn_flag_count and dst_bytes contributed negatively.
These findings align with Sayduzzaman et al.
| [9] | M. Sayduzzaman, J. T. Tamanna, D. Kundu, and T. Rahman, “Interoperability and explicable AI-based zero-day attacks detection process in smart community,” arXiv preprint arXiv: 2408.02921, 2024. |
[9]
and Krishnan et al.
and demonstrate the value of combining explainability with sequence-aware temporal learning and independent cross-domain evaluation.
5.4. Comparison with Previous Studies and Research Implications
The comparison with previous studies shows that the proposed framework achieved 96.89% accuracy, compared with 95.8% reported by Sarhan et al.
| [1] | M. Sarhan, S. Layeghy, M. Gallagher, and M. Portmann, “From zero-shot machine learning to zero-day attack detection,” arXiv preprint arXiv: 2109.14868, 2021. |
[1]
, 94.7% by Armijos and Cuenca
| [14] | A. Armijos and E. Cuenca, “Zero-day attacks: Review of the methods used based on intrusion detection and prevention systems,” 2023 IEEE Colombian Caribbean Conference (C3), pp. 1-6, 2023. |
[14]
, 96.5% by Sayduzzaman et al.
| [9] | M. Sayduzzaman, J. T. Tamanna, D. Kundu, and T. Rahman, “Interoperability and explicable AI-based zero-day attacks detection process in smart community,” arXiv preprint arXiv: 2408.02921, 2024. |
[9]
, 95.3% by Alansary et al.
| [12] | S. A. Alansary, S. M. Ayyad, F. M. Talaat, and M. M. Saafan, “Emerging AI threats in cybercrime: A review of zero-day attacks via machine, deep, and federated learning,” Knowledge and Information Systems, vol. 67, pp. 10951-10987, 2025, https://doi.org/10.1007/s10115-025-02556-6 |
[12]
, and 96.2% by Diana et al.
. However, its F1-score of 93.38% was lower than the 94.6%, 93.2%, 94.8%, 94.1%, and 95.0% reported by these studies, respectively. Thus, the framework should not be considered superior across all metrics.
Its contribution lies in combining temporal learning, hybrid deep learning, explainability, and independent cross-domain evaluation. Previous studies indicate that many approaches focus on particular benchmark datasets, with cross-domain validation and explainability less consistently integrated
| [2] | Z. Dai, L. Y. Por, Y.-L. Chen, J. Yang, C. S. Ku, R. Alizadehsani, and P. Pławiak, “An intrusion detection model to detect zero-day attacks in unseen data using machine learning,” PLOS ONE, vol. 19, no. 9, Art. no. e0308469, 2024,
https://doi.org/10.1371/journal.pone.0308469 |
| [3] | B. I. Hairab, H. K. Aslan, M. S. Elsayed, A. D. Jurcut, and M. A. Azer, “Anomaly detection of zero-day attacks based on CNN and regularization techniques,” Electronics, vol. 12, no. 3, Art. no. 573, 2023,
https://doi.org/10.3390/electronics12030573 |
| [4] | H. Hindy, R. Atkinson, C. Tachtatzis, J.-N. Colin, E. Bayne, and X. Bellekens, “Utilising deep learning techniques for effective zero-day attack detection,” Electronics, vol. 9, no. 10, Art. no. 1684, 2020,
https://doi.org/10.3390/electronics9101684 |
| [5] | C. Brunner, A. Kő, and S. Fodor, “An autoencoder-enhanced stacking neural network model for increasing the performance of intrusion detection,” Journal of Applied Security Research, vol. 12, no. 2, pp. 149-163, 2022,
https://doi.org/10.2478/jaiscr-2022-0010 |
| [6] | A. Khraisat and A. Alazab, “A critical review of intrusion detection systems in the internet of things: Techniques, deployment strategy, validation strategy, attacks, public datasets and challenges,” Cybersecurity, vol. 4, Art. no. 18, 2021,
https://doi.org/10.1186/s42400-021-00077-7 |
[2-6]
,
| [9] | M. Sayduzzaman, J. T. Tamanna, D. Kundu, and T. Rahman, “Interoperability and explicable AI-based zero-day attacks detection process in smart community,” arXiv preprint arXiv: 2408.02921, 2024. |
| [10] | M. A. Alparacha, S. U. Jamil, K. Shahzad, M. A. Khan, and A. Rasheed, “Leveraging AI for network threat detection—A conceptual overview,” Electronics, vol. 13, Art. no. 4611, 2024, https://doi.org/10.3390/electronics134611 |
| [11] | D. Krishnan, S. Singh, and V. Sugumaran, “Explainable AI for zero-day attack detection in IoT networks using attention fusion model,” Research Square, 2025,
https://doi.org/10.21203/rs.3.rs-5436116/v1 |
| [12] | S. A. Alansary, S. M. Ayyad, F. M. Talaat, and M. M. Saafan, “Emerging AI threats in cybercrime: A review of zero-day attacks via machine, deep, and federated learning,” Knowledge and Information Systems, vol. 67, pp. 10951-10987, 2025, https://doi.org/10.1007/s10115-025-02556-6 |
| [13] | L. Diana, P. Dini, and D. Paolini, “Overview on intrusion detection systems for computers networking security,” Computers, vol. 14, no. 3, Art. no. 87, 2025,
https://doi.org/10.3390/computers14030087 |
| [14] | A. Armijos and E. Cuenca, “Zero-day attacks: Review of the methods used based on intrusion detection and prevention systems,” 2023 IEEE Colombian Caribbean Conference (C3), pp. 1-6, 2023. |
[9-14]
. The proposed framework addresses these aspects through independent cross-domain testing and SHAP and LIME explanations.
However, the cross-domain results also show that differences in traffic characteristics, attack distributions, and network conditions can affect generalization
| [2] | Z. Dai, L. Y. Por, Y.-L. Chen, J. Yang, C. S. Ku, R. Alizadehsani, and P. Pławiak, “An intrusion detection model to detect zero-day attacks in unseen data using machine learning,” PLOS ONE, vol. 19, no. 9, Art. no. e0308469, 2024,
https://doi.org/10.1371/journal.pone.0308469 |
| [3] | B. I. Hairab, H. K. Aslan, M. S. Elsayed, A. D. Jurcut, and M. A. Azer, “Anomaly detection of zero-day attacks based on CNN and regularization techniques,” Electronics, vol. 12, no. 3, Art. no. 573, 2023,
https://doi.org/10.3390/electronics12030573 |
| [4] | H. Hindy, R. Atkinson, C. Tachtatzis, J.-N. Colin, E. Bayne, and X. Bellekens, “Utilising deep learning techniques for effective zero-day attack detection,” Electronics, vol. 9, no. 10, Art. no. 1684, 2020,
https://doi.org/10.3390/electronics9101684 |
| [5] | C. Brunner, A. Kő, and S. Fodor, “An autoencoder-enhanced stacking neural network model for increasing the performance of intrusion detection,” Journal of Applied Security Research, vol. 12, no. 2, pp. 149-163, 2022,
https://doi.org/10.2478/jaiscr-2022-0010 |
| [6] | A. Khraisat and A. Alazab, “A critical review of intrusion detection systems in the internet of things: Techniques, deployment strategy, validation strategy, attacks, public datasets and challenges,” Cybersecurity, vol. 4, Art. no. 18, 2021,
https://doi.org/10.1186/s42400-021-00077-7 |
[2-6]
. Future research should therefore consider additional datasets, realistic enterprise traffic, and representative unseen attack scenarios. Broader cross-dataset and live-traffic evaluation may provide stronger evidence of practical applicability while maintaining a clear distinction between direct cross-domain evaluation and approaches involving retraining or adaptation.
5.5. Limitations of the Study
The study has several limitations that should be considered when interpreting the findings. First, the evaluation relies on benchmark datasets rather than live enterprise network traffic. Second, only 50,000 records were sampled from each dataset, and the samples may not represent the full diversity of traffic and attack behaviour contained in the original datasets. Third, the 20-record sequence length was used as a fixed design configuration without a separate sensitivity analysis of alternative sequence lengths. Finally, the cross-domain evaluation demonstrates transferability to an independent dataset but does not constitute direct validation against a confirmed zero-day vulnerability or attack. These limitations provide opportunities for future evaluation using larger datasets, alternative temporal window sizes, realistic enterprise traffic and independently verified unseen attack scenarios.

 ,
Obi Chukwuemeka Nwokonkwo
,
Obi Chukwuemeka Nwokonkwo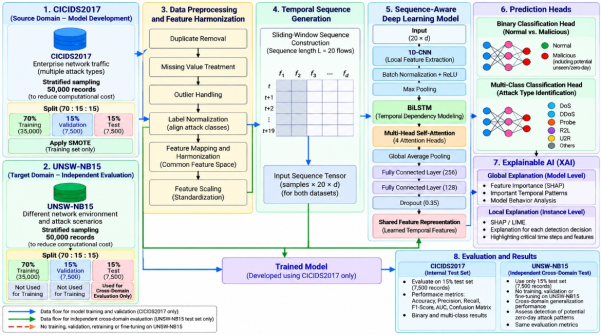



 Share This Article
 Twitter
 Linked In
 Facebook
 Copy
Copy Download